The key objective of this blog is to understand tolerances analysis definition, methodologies, key attributes, statistical parameter usage, advantages, software comparisons, and its latest trends. It also briefly covers tolerance allocation methods and finally ends with Improvians take on the overall review.
Tolerance Analysis
DEFINITION
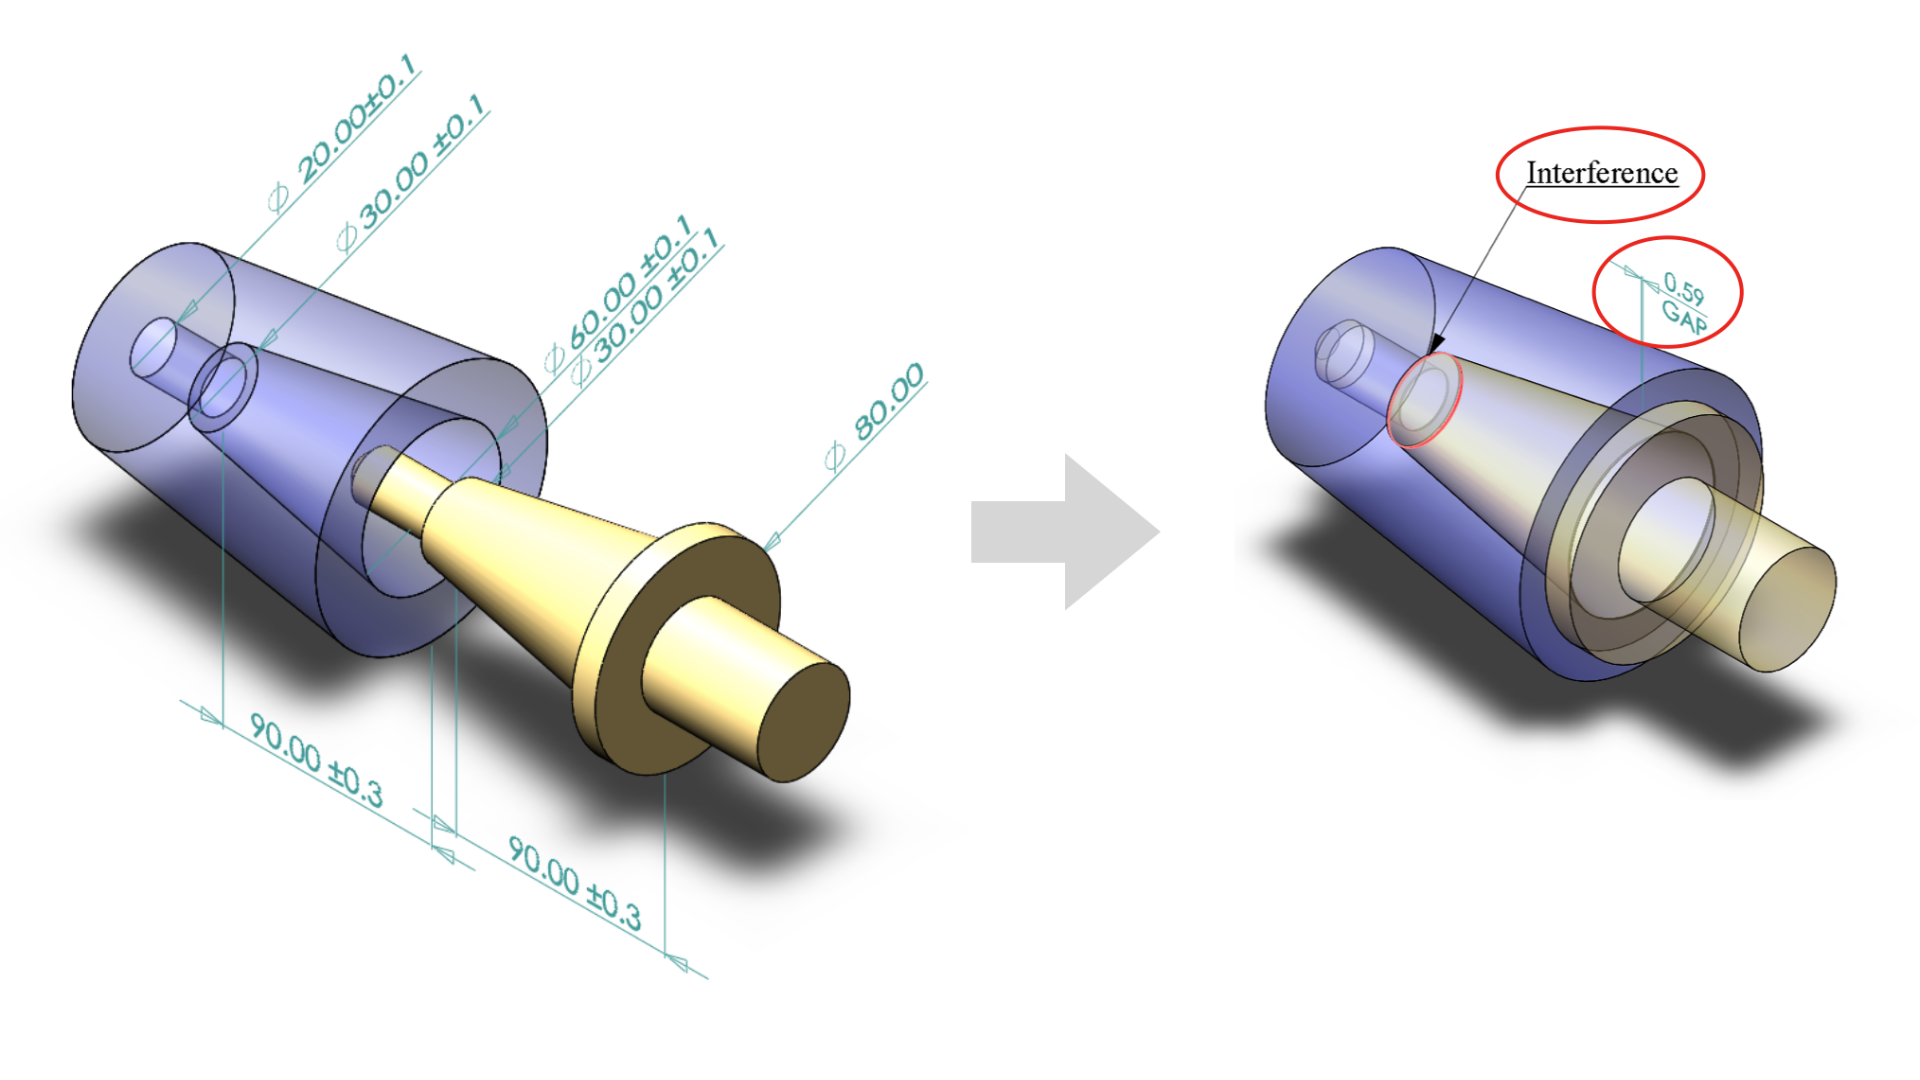
Tolerance stack-up analysis calculates the overall effect of part tolerances on an assembly functionality requirement. The term "stacking up" refers to the addition of tolerances to find the total part tolerance and then comparing that to the available gaps or performance limits to ensure the design will meet its functional requirements. There are different methods of doing a tolerance analysis. Let's understand each of them.
METHODS
1) Worst Case Analysis [WCA]
Worst-case analysis is a direct addition of part tolerances to determine assembly variation. Through this approach, the individual part acceptance will be 100% and no interference will occur. This may also lead to over-design, example preserved assembly gap is too large. This approach is advisable for extremely critical applications where part per million (ppm) defects needs to be zero. It is also useful and appropriate for problems that involve just three or four parts. This analysis is mostly done in one direction, i.e. a 1D analysis. If the analysis has part dimensions which are not in the plane of the assembly measurement being studied, the stack-up approach needs to be modified to 2D analysis to factor in angles, or any variation which is not parallel to the 1D direction.
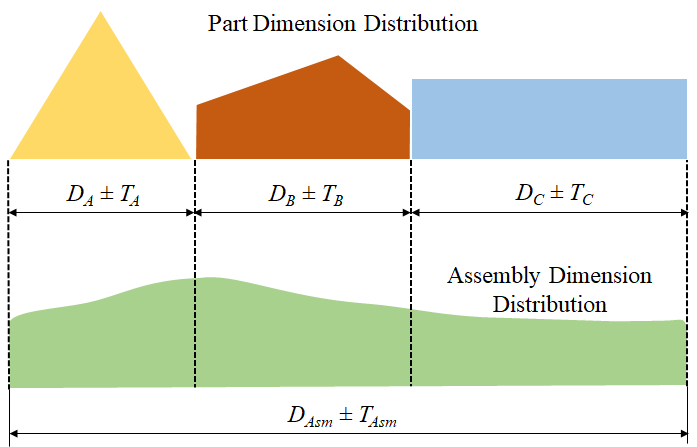
TAsm = TA + TB + TC
Figure 1: Assembly tolerance determination using Worst Case Analysis (WCA)
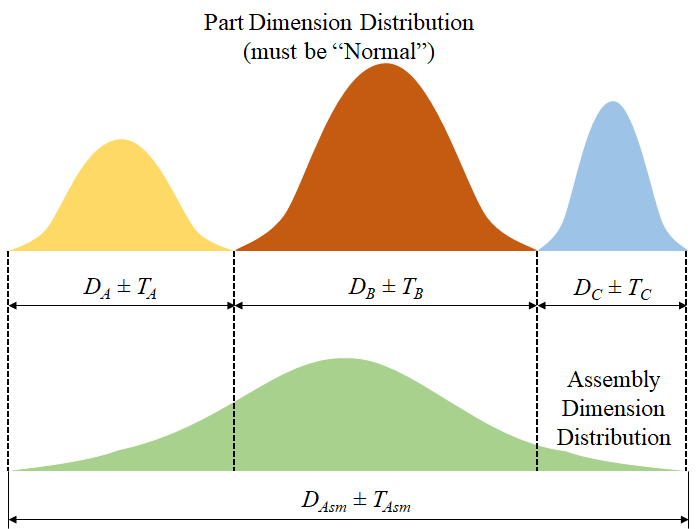
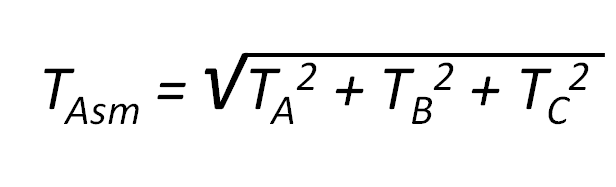
2) Root Sum Squared Analysis [RSS]
In this method, instead of adding up tolerances, as in worst-case analysis, assembly variation is the root sum square of the individual component tolerance values. RSS assumes the dimensional distribution of each component is normal which is typically the case in mass production. This allows comparison of the standard deviation to the assembly limits which can help in the calculation of quality metrics like Cpk, Cp, Ppk, etc. This approach requires distributions to be normal with all parts at the same quality level, i.e. +/- 3σ.
3) Monte Carlo Analysis [MCA]
Monte Carlo analysis is an iterative method to calculate assembly variations by randomly changing possible values of the dimension, each obtained by following a specific distribution. It is the most suitable method when assemblies of parts have non-linear effects on the system or the individual components of the systems do not follow a normal distribution.
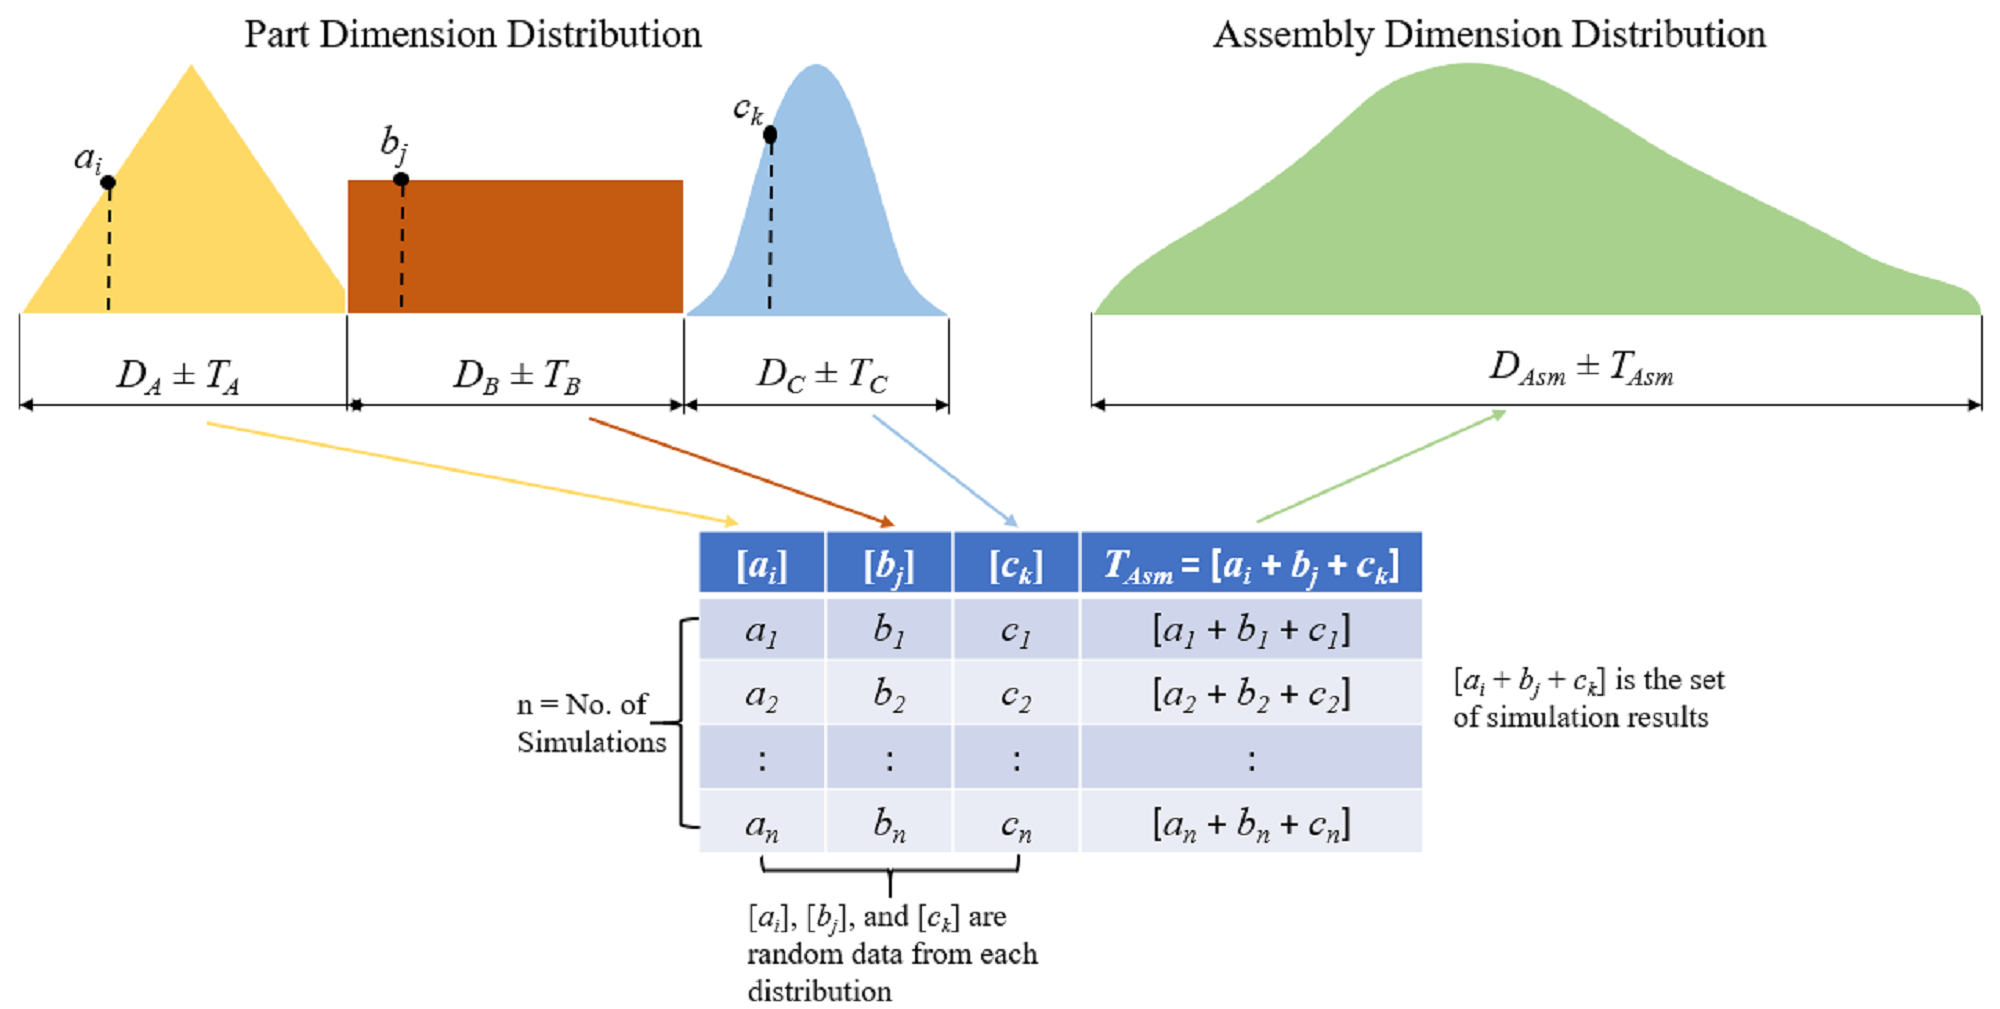
TAsm = [ai + bj + ck] …Simulation Results
Figure 3: Assembly tolerance determination using Monte Carlo Analysis (MCA)
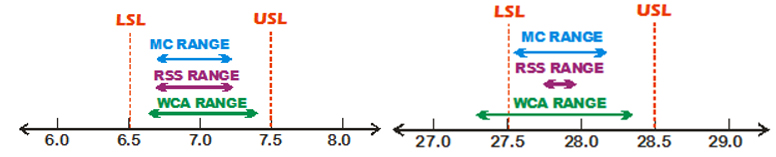
As the figure shows the WCA range is always larger while RSS and MCA range depends on the input parameters of the analysis.
Key Attributes in Tolerance Analysis:
Tolerance analysis gives the following key parameters as outputs to evaluate and validate your design.
- Sensitivity: It is a measure of how the unit change in any dimension affects the final assembly dimension under study. It is one of the key factors to determine which areas of geometry can be improved.
- Contributors: It gives the percentage contribution of each component tolerance on the final assembly tolerance. This helps in determining the targets for tightening or loosening the tolerances.
- Range: The range of assembly variation is derived based on the assembly tolerance as shown in figure 4.
- Frequency Histogram: It is a graphical representation showing the probability of assembly variation and its values. The type of distribution, mean and standard deviation can be calculated based on it.
USE OF STATISTICAL PARAMETERS IN TOLERANCE ANALYSIS PLATFORM
Root sum squared and other assembly variation analysis methods provide process capability and performance indices that must be controlled to produce a part that meets the assembly requirements. Using these matrices such as Cpk, Cp, Ppk, design engineer can allocate tolerance budgets tactfully. Manufacturing can then use this process and performance indices to focus on developing and refining their manufacturing process to meet them. Typically, the requirement for Cpk = 1.67 for key features which have ppm of 0.573 and Cp = 1.33 for non-key features which have ppm of 63.34. These decisions ensure optimum product quality, performance and manufacturing cost.
ADVANTAGES OF TOLERANCE ANALYSIS PLATFORM
- The assembly parts can be readily replaceable and interchangeable.
- It reduces the manufacturing cost by reducing accuracy but maintaining functionality and design intent.
- The control of manufacturing processes becomes easy.
- It reduces part to part variations and improves quality.
- With the data from manufacturing, individual component dimensional distribution can be updated to obtain more realistic assembly variation tolerances.
Tolerance Analysis Platform
1. 3DCS Variation Analyst
- Type of Analysis: 1D, 2D, 3D
- Methods of Analysis: Worst Case, RSS, Monte Carlo
- CAD integration as Add-In: PTC Creo, Catia, NX, SolidWorks
- Standalone Analysis with Supported Formats: STEP, IGES, STL, OBJ, CGR, Parasolid, JT
- Additional Features:
- Plant data and actual manufacturing data can be incorporated for validation.
- Assembly process, tooling, fixture, clamping, locators, datums can be modeled and their added variations can be taken into account.
- FEA compliant analysis is available for flexible parts such as sheet metal parts, rubber components.
- Sensitivity or HLM (High-Low-Median) Analysis to analyze key contributors on the final assembly variation by only changing one component tolerance at a time to its high, median and low value.
- Geo Factor Analysis is used to analyze key tolerance contributors based on geometry of components and assembly. Geo Factor can be used for deciding the changes in geometry to improve design.
- Key Tolerance Analysis Output Parameters: Assembly variation, Distribution of Assembly Variation, Sensitivities, Contributions, Geo Factor.
2. CETOL 6σ
- Type of Analysis: 1D, 2D, 3D
- Methods of Analysis: Worst Case, RSS, Monte Carlo
- CAD Integration as Add-In: PTC Creo, Catia, NX, SolidWorks
- Standalone Analysis with Supported Formats: None
- Additional Features: Tolerance Advisor which guides for next steps or items which should be reviewed by the user.
- Key Tolerance Analysis Output Parameters: Assembly Variation, Distribution of Assembly Variation, Sensitivities, Contributions.
3. Enventive
- Type of Analysis: 1D, 2D, 3D
- Methods of Analysis: Worst Case, RSS, Monte Carlo
- CAD Integration as Add-In: None
- Standalone Analysis with Supported Formats: STEP, IGES
- Additional Features:
- Performance modeling in which the values can be governed by an equation. It simultaneously solves equations and computes tolerance. Any physical phenomenon which is governed by an equation such as friction, thermal expansion, deflection due to force, etc. can be modeled.
- Smart components and Smart Assemblies use engineering data for standard components such as springs, bolts, bearings, shafts, etc. to compute their functional properties. The data canal so be customized according to the required specifications.
- Key Tolerance Analysis Output Parameters: Assembly Variation, Distribution of Assembly Variation, Sensitivities, Contributions.
4. TolAnalyst
- Types of Analysis: 1D, 2D, 3D
- Methods of Analysis: Worst Case, RSS
- CAD Integration as Add-In: SolidWorks
- Standalone Analysis with Supported Formats: None
- Additional Features: None
- Key Tolerance Analysis Output Parameters: Assembly Variation, Distribution of Assembly Variation, Sensitivities, Contributions.
5. Geometric StackUp
- Types of Analysis: 1D
- Methods of Analysis: Worst Case, RSS
- CAD Integration as Add-In: SolidWorks & PTC Windchill
- Standalone Analysis with Supported Formats: CAD files of SolidWorks, Solid Edge, NX, Inventor, Catia, Creo, STEP, IGES, JT, Parasolid
- Additional Features: None
- Key Tolerance Analysis Output Parameters: Assembly Variation, Distribution of Assembly Variation, Sensitivities, Contributions.
6. Inventor Tolerance Analysis
- Types of Analysis: 1D
- Methods of Analysis: Worst Case, RSS
- CAD Integration as Add-In: Autodesk Inventor
- Standalone Analysis with Supported Formats: None
- Additional Features: None
- Key Tolerance Analysis Output Parameters: Assembly Variation, Distribution of Assembly Variation, Sensitivities, Contributions.
Tolerance Allocation
This method works in reverse order wherein the tolerances on assembly are given and individual component tolerances are assigned based on it. Tolerance analysis is then performed to validate the allocations. There are various methods to allocate and re-allocate tolerances. Some of the methods are:
- Proportional Scaling Method:
In this method, tolerances to individual components are assigned based on process guidelines and then analyzed using tolerance analysis. If the assembly specifications are not fulfilled the tolerances are scaled by a proportionality factor. The proportionality factor is the ratio of required assembly tolerance to total tolerance on assembly function. This method of allocation can only be used in initial stages of allocation and requires prior knowledge of tolerances. It does not consider the factors on which manufacturing cost depends such as size, shape, material & manufacturing process. - Constant Precision Factor Method:
Here, allocations are done on the assumption that the tolerances of parts are equal if they are same in size. The size of part is determined by the cube root of its length. The constant precision factor is the ratio of required assembly tolerance to a summation of its size. Individual part tolerances are calculated by multiplying constant precision factor to the size of part. This method is useful for allocating tolerance when tolerance data is not known. This method also does not consider material of part, manufacturing process and cost. - Weight Factor Method:
This method is modification of proportional scaling method. With proportionality factor, a weight factor is also multiplied with part tolerances. The weight factor is assigned according to the manufacturability of the part. The harder the machining, the higher the weight factor. Although the method does take consideration of machining difficulties, it is not very defined. There is no systematic way of assigning weight factor and it requires prior data regarding manufacturing and tolerances. - Least Cost Optimization:
This is a more promising method of allocating tolerance. It evaluates machining cost of each part. The cost and tolerance relation are given by various curves.Total cost is optimized to a minimum with assembly function requirements as constraints. The cost-tolerance curves are rarely verified because the manufacturing cost data depends too much on the site, location of manufacturing.
Improvians Take
From all the available tools, 3DCS Variation Analyst and CETOL 6σ are leading choices for 3D tolerance analysis. The interface of both tools is very user-friendly. And also they can be readily integrated with most CAD software. Nevertheless, if the design has a lot of equation driven dimensions then Enventive is a good option to consider, but learning the interface may take some time. If you are using SolidWorks then TolAnalyst is a good option if you don’t want to spend extra since it already comes as Add-In with SolidWorks Professional & Premium. Standalone capabilities of the software can be considered if they are not compatible with CAD software being used. For simple 1D analysis, Geometric Stack Up can be used. Inventor Tolerance Analysis only has a 1D feature and works only with Inventor. So, overall the software selection depends on the individual tolerance analysis objectives and complexity. We have not considered cost in this blog, but it is also a major factor when selecting the right software.
- https://www.3dcs.com/
- https://www.sigmetrix.com/products/cetol-tolerance-analysis-software/
- https://www.enventive.com/en/products/
- https://help.solidworks.com/2017/English/SolidWorks/tolanalyst/c_TolAnalyst_Overview.htm
- https://tolerancestackup.com/
- https://www.autodesk.com/products/inventor-tolerance-analysis/overview
- https://accendoreliability.com/reliability-and-monte-carlo-determined-tolerances/
- Dimensioning and Tolerancing Handbook, Paul J.Drake, Jr., McGrow Hill
- https://www.crystalballservices.com/Research/Articles-on-Analytics-Risk/author/karl-cb-expert/pager/566/page/4
- Tolerance Allocation Methods for Designers, ADCATSReport No. 99-6, Kenneth W. Chase Department of Mechanical Engineering BrighamYoung University
- A Tolerance Allocation Framework Using FuzzyComprehensive Evaluation and Decision Support Processes, Abhishek Kumar, MSThesis, December 2010, Georgia Institute of Technology
- http://yuhsiulee.blogspot.com/2014/02/tolerance-design.html#more5wq
Our Blogs