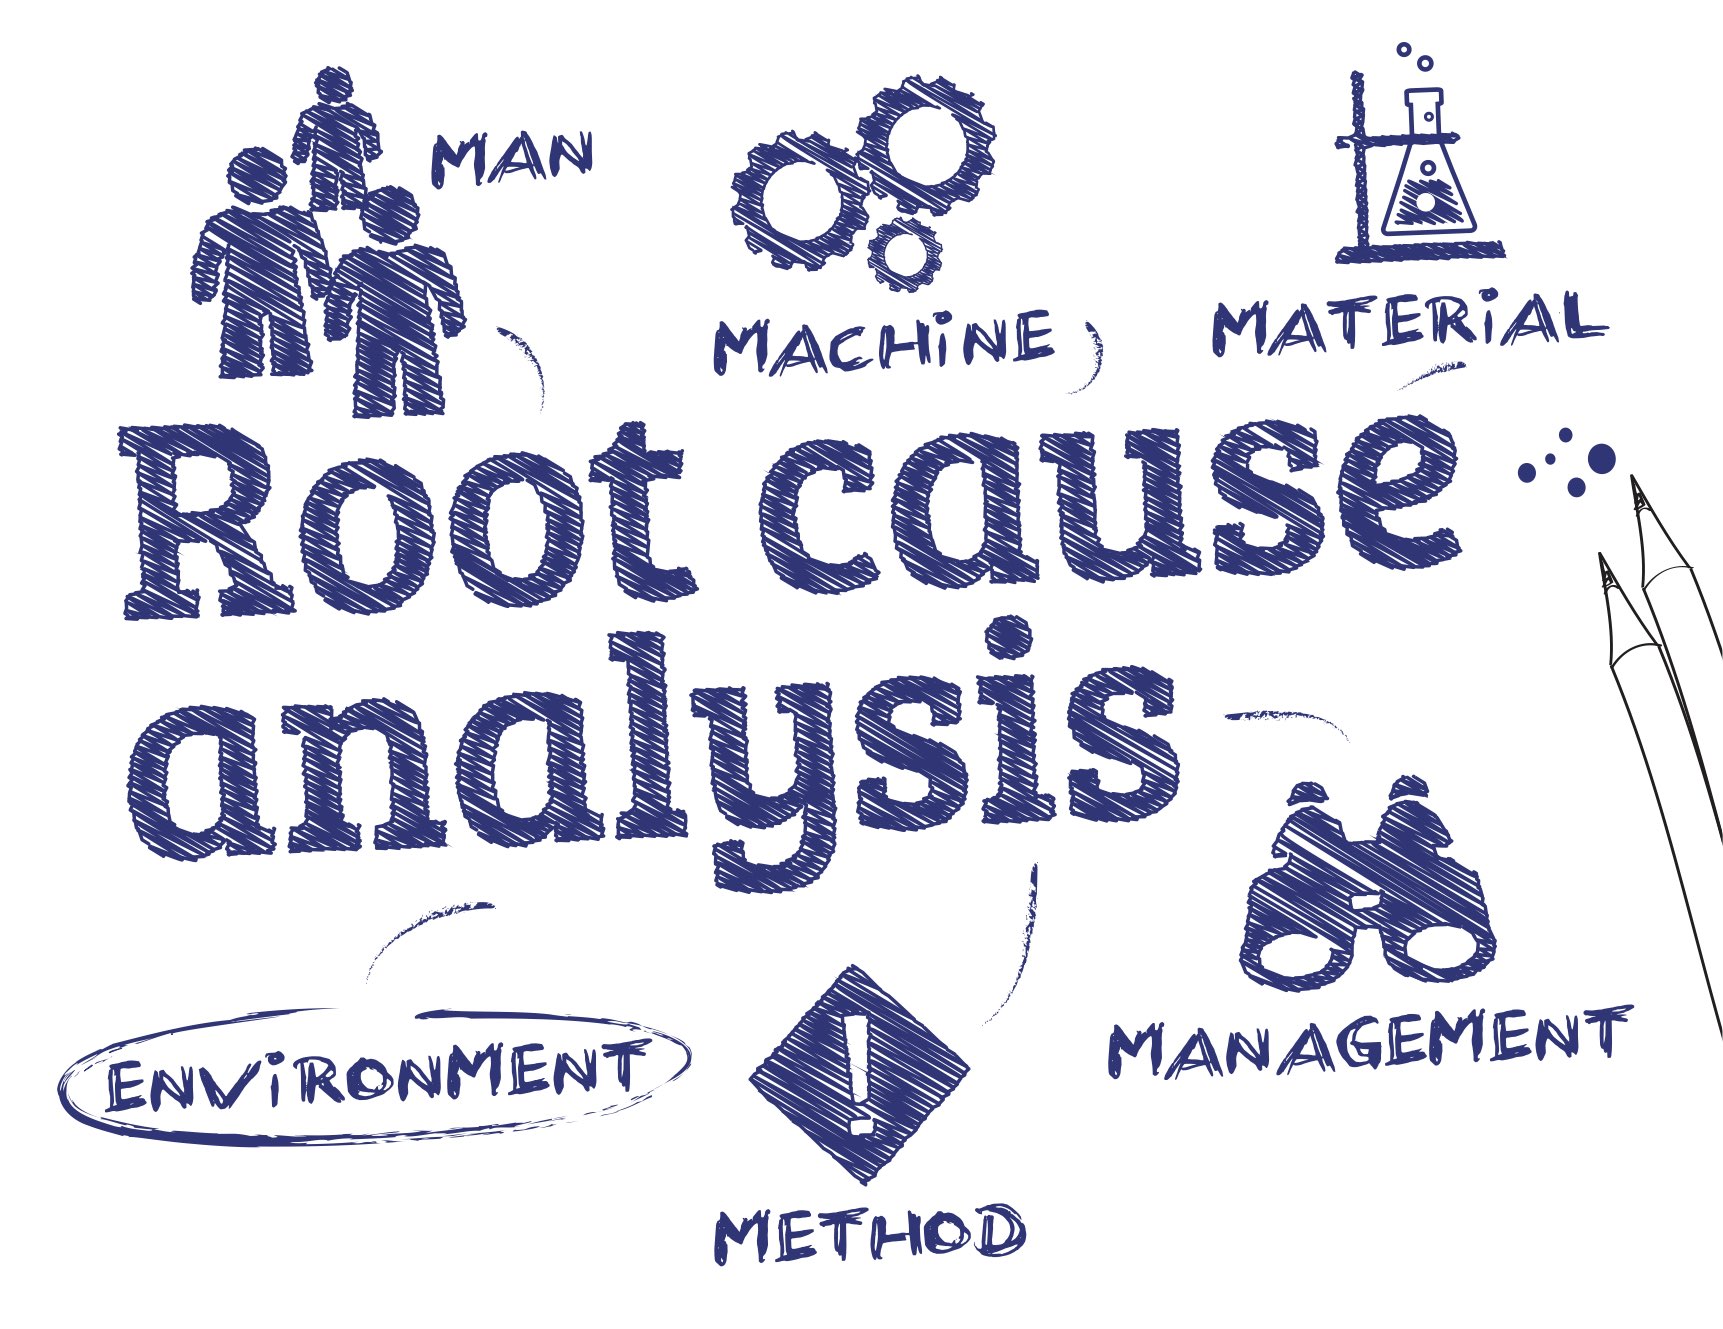
We, humans, have a natural gift of creativity, memory and imagination and we can attribute our ability to develop complex engineering systems to these gifts. Inevitably, the rise in complexity is accompanied by a rise in the problems that need troubleshooting. In this result-oriented world, often we don’t invest time in performing in-depth analysis in problem-solving. Instead, we opt for remedial actions to make the problem less visible or employ a patchwork type of solutions, hoping the problem won't resurface. When such solutions are employed, the probability of recurrence of that problem becomes high. Engineers at this junction employ the "Root cause Analysis."
This article intends to acquaint the reader with the philosophy of Root-Cause analysis and its underlying methodologies. This article also puts forth the tools that aid the analysis.
Terminology
Problem statement: A problem statement is a concise description of an issue to be addressed or a condition to be improved upon.
Cause: It is efficacy, by which one event, process or state contributes to the production of another event, process, or state.
Different level of causes
- Symptoms: These are not regarded as causes but are signs of the existence of a problem. The simplest example would be, defective parts produced by a machine.
- First level Causes: Causes that directly lead to a problem
- Higher Level Causes: Causes that lead to the first-level cause. These form a cause and effect chain that may lead to a catastrophic effect on the functionality or in some cases compromise the system physically.
Root-Cause Analysis: The root-cause analysis is a set of mental activities that help in the identification of the true cause of a problem and then suggesting actions necessary to eliminate it.
Objectives
- The objective of RCA is striking at the root and prevention of recurrence. We can say that it is the ultimate tool for problem-solving. It focuses primarily on the effective diagnosis of the problem.
- The key factor for the implementation of RCA is to make an informed decision. The RCA process must employ people with adequate practical experience. This will ensure that the information used in the analysis is valuable. For example, if a manager decides to employ the "Ask Why five times” approach on an intern (learning the operation) and a seasoned operator, the information from the latter will be valuable.
- In this case, the actions pertaining “Ask why five times” approach are the part of the Root-Cause analysis. The RCA process ends only after an informed decision is made to mitigate the problem.
- The approach to Root -cause Analysis is a structured approach but not highly regimented, so every organization has a unique approach to RCA.
- The result desired will remain constant, complete mitigation of the problem such that the probability of recurrence is minimum . Some of the approaches are geared more toward identifying the true root causes than others; some are more general problem-solving techniques, while others simply offer support for the core activity of root cause analysis. Some tools are characterized by a structured approach, while others are more creative (and haphazard) in nature.
Tools in RCA
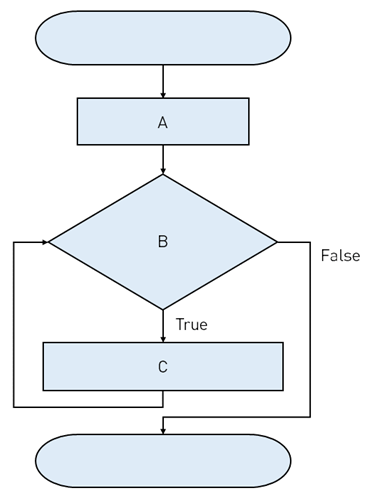
Flowcharts
Flow charts can be used in various stages of the RCA process. It is a fundamental tool in understanding the process. It helps in converting the actual work process to a logical flow diagram portraying the activities involved in the process. The flow charts are created using the ANSI standard symbols for flow charts. Inclusion of all working elements in the flow chart is essential. Inputs from all the departments concerned are very important. Define the role of the customers, in the chart, as they receive the output and provide part of the input. Also, include the suppliers in the chart, they are the other half of the input.
Brain Storming
Brainstorming is an essential tool in root cause analysis. Brainstorming involves a team of knowledgeable people coming together and generating hypotheses for the causes or generating solutions for the identified cause. Brainstorming should ideally be divided into two phases:
- Idea generation- Each member must contribute to this stage. This ensures that the team spirit stays intact. In this stage it is the duty of the manager, to ensure that the team does not get divide into one half generating ideas and the other judging them. This discourages the team members from contributing to the idea-pool.
- Judgment on ideas- The judgment on each idea should take place to evaluate and eliminate the obsolete.
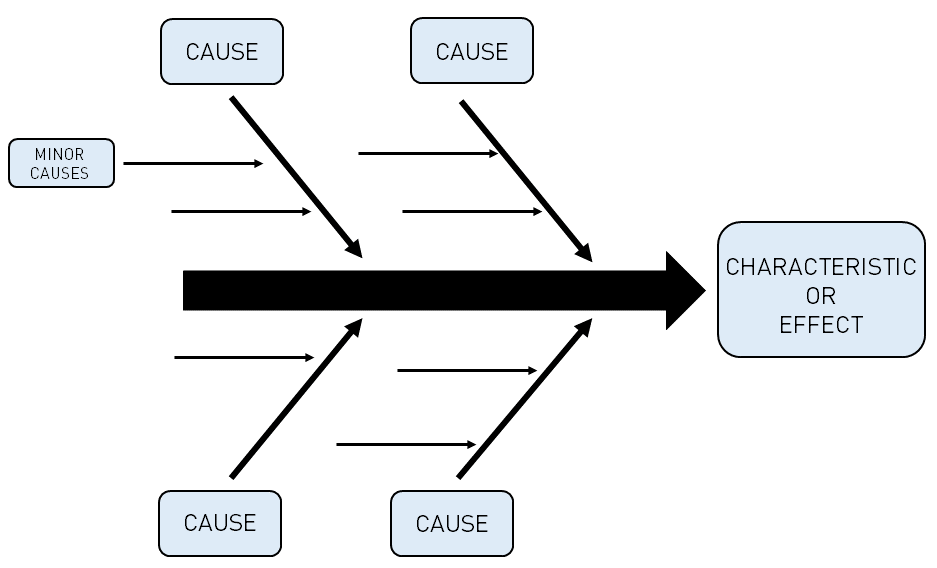
Cause and Effect Diagram
The cause and effect diagram was created by Professor Kaoru Ishikawa in 1943. This diagram is popularly known as the Fish-Bone Diagram. This tool enables the team to focus on the content of the problems rather than the history (i.e. when and rate of recurrence). The development of the Cause- Effect Diagram is a part of the Structured Brainstorming Exercise.
Steps for creating the diagram are as follows:
Step 1: Decide on the problem to improve or control.
Step 2: Define the characteristic Effect.
Step 3: Write the main factors that may be causing the problem by drawing major branch arrows to the main arrow.
step 4: Detailed causal factors are written as twigs on each major branch of the diagram.
Step 5: Ensure all the factors are considered.
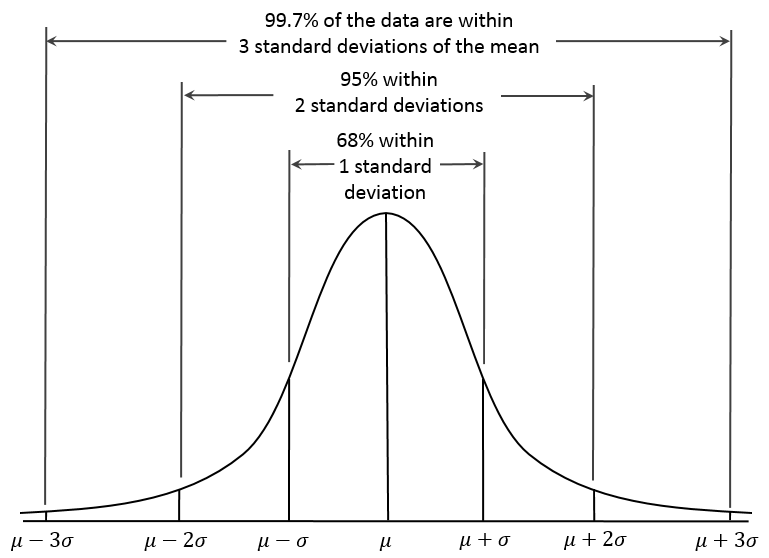
Statistical Analysis
The statistical analysis is very effective tool in analysing the data collected about the problem. The data may follow a normal or non-normal distribution. Depending on the type of distribution, different tests can be used to do statistical comparisons. Design of experiment (DOE) can be setup to categorically collect and compare the results between different variables. There are myriad of statistical tools and techniques that can be used to analyse the large data. This approach is data driven and helps you make decision more objectively. This data is also useful for Quality assessment.
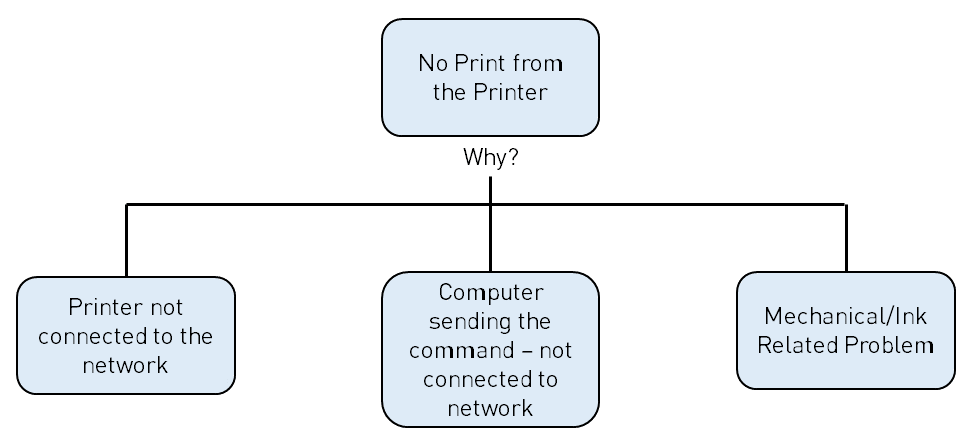
Logic Tree
A logic tree is quite similar to a flowchart. It is specifically used when there is no standardised work process. The logic tree is a visual illustration of the Ask why five times approach. The logic tree can be constructed using different mindsets.
- Functional analysis- The logical explanation of the functionality of the process or product.
- Component focused- The diagram is constructed focussing on which component might have failed.
- Failure Mode- Primary Modes of failure-based logic Tree is constructed.
- Process-Based- Major steps involved in providing a service are depicted in the logic tree.
Methodologies
Ask Why Five times- This process is used for simple problems, wherein the manager, repeatedly asks questions until the actual root cause comes forth. This is a simple and elegant way to approach routine day to day problems. Generally, by the 3rd why the probable root causes start appearing.
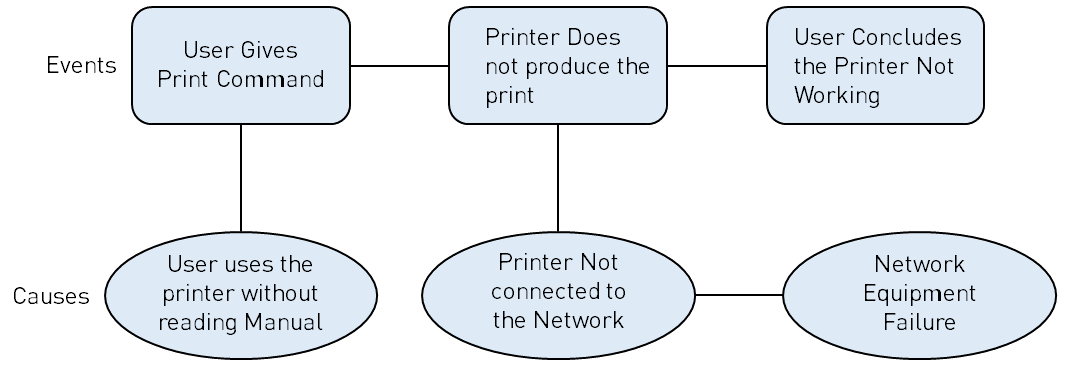
Events and causal factor analysis— This process is widely used for major, single event problems such as a fire in the electrical system of machinery. It creates a timeline of activities that took place leading to the event and is based on the analysis of the methodically gathered evidence. Contributing factors can be thus identified.
Change analysis— This approach applies to situations where a system's performance has shifted significantly. It deals with the changes made to the working elements of the process under consideration for Root- Cause analysis. It analyses the changes brought about by the problem under consideration. The technique useful for this analysis is evaluating the time frame when changes occurred and when the problem was detected.
Change analysis— This technique base on the detection and prevention of occurrence of a problem. When designing a system, the designer installs certain controls that prevent the occurrence of a problem. When a problem occurs, one of these barriers may have failed. The barrier is categorised as soft (Administrative) barriers and hard (Physical) barriers.
Further, they can be classified as
- Preventive Barrier-Activities performed during Design of the product (FEA, Simulation, validation testing, etc.)
- Detection Barriers – Activities performed to improve the quality of the Product delivered by a system. (inspection and screening).
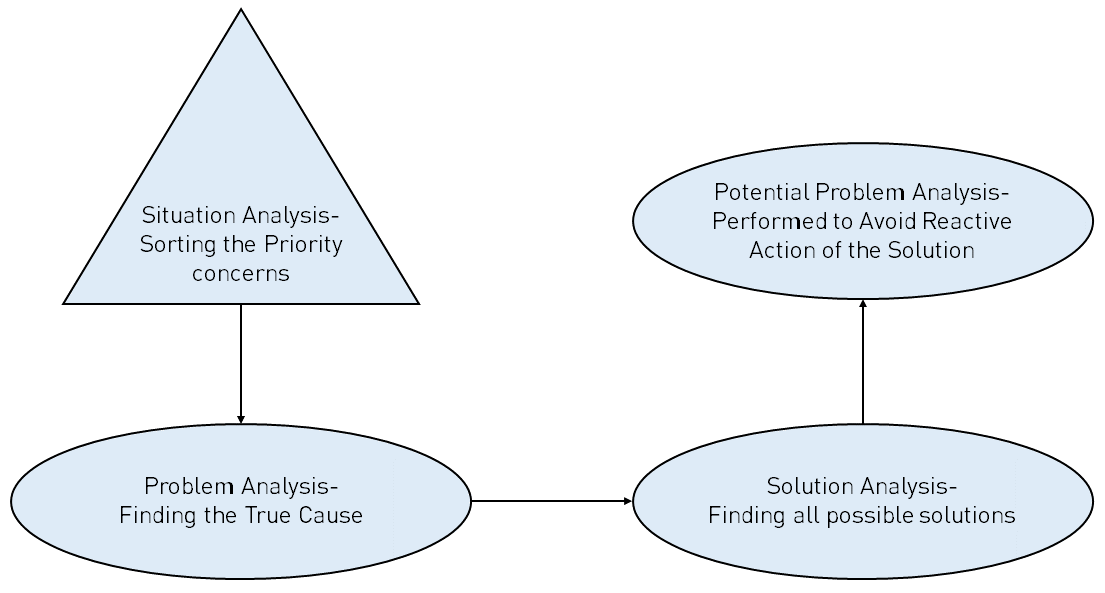
Kepner-Tregoe Problem Solving— This model is quite extensive. And helps in the solution of complex problems methodically. This model makes sure that at the end of the undertaken analysis an informed decision is made.
This model provides four distinct phases for resolving problems:
- Situation analysis
- Problem analysis
- Solution analysis
- Potential problem analysis.
Six Sigma DMAIC (Define- Measure- Analyse -Improve -Control) — DMAIC is a data-driven quality assurance strategy for improving the process. It is a standalone methodology to address a problem.
Advantages of using this model:
- Makes sure the organization is working on the right problems and has the right team to work the problem.
- Considering the Critical-to-Customers measures
- Evaluating the reliability, stability, and capability of the process continually.
- Maintaining revenue while identifying performance parameters and changing the process to improve the parameters.
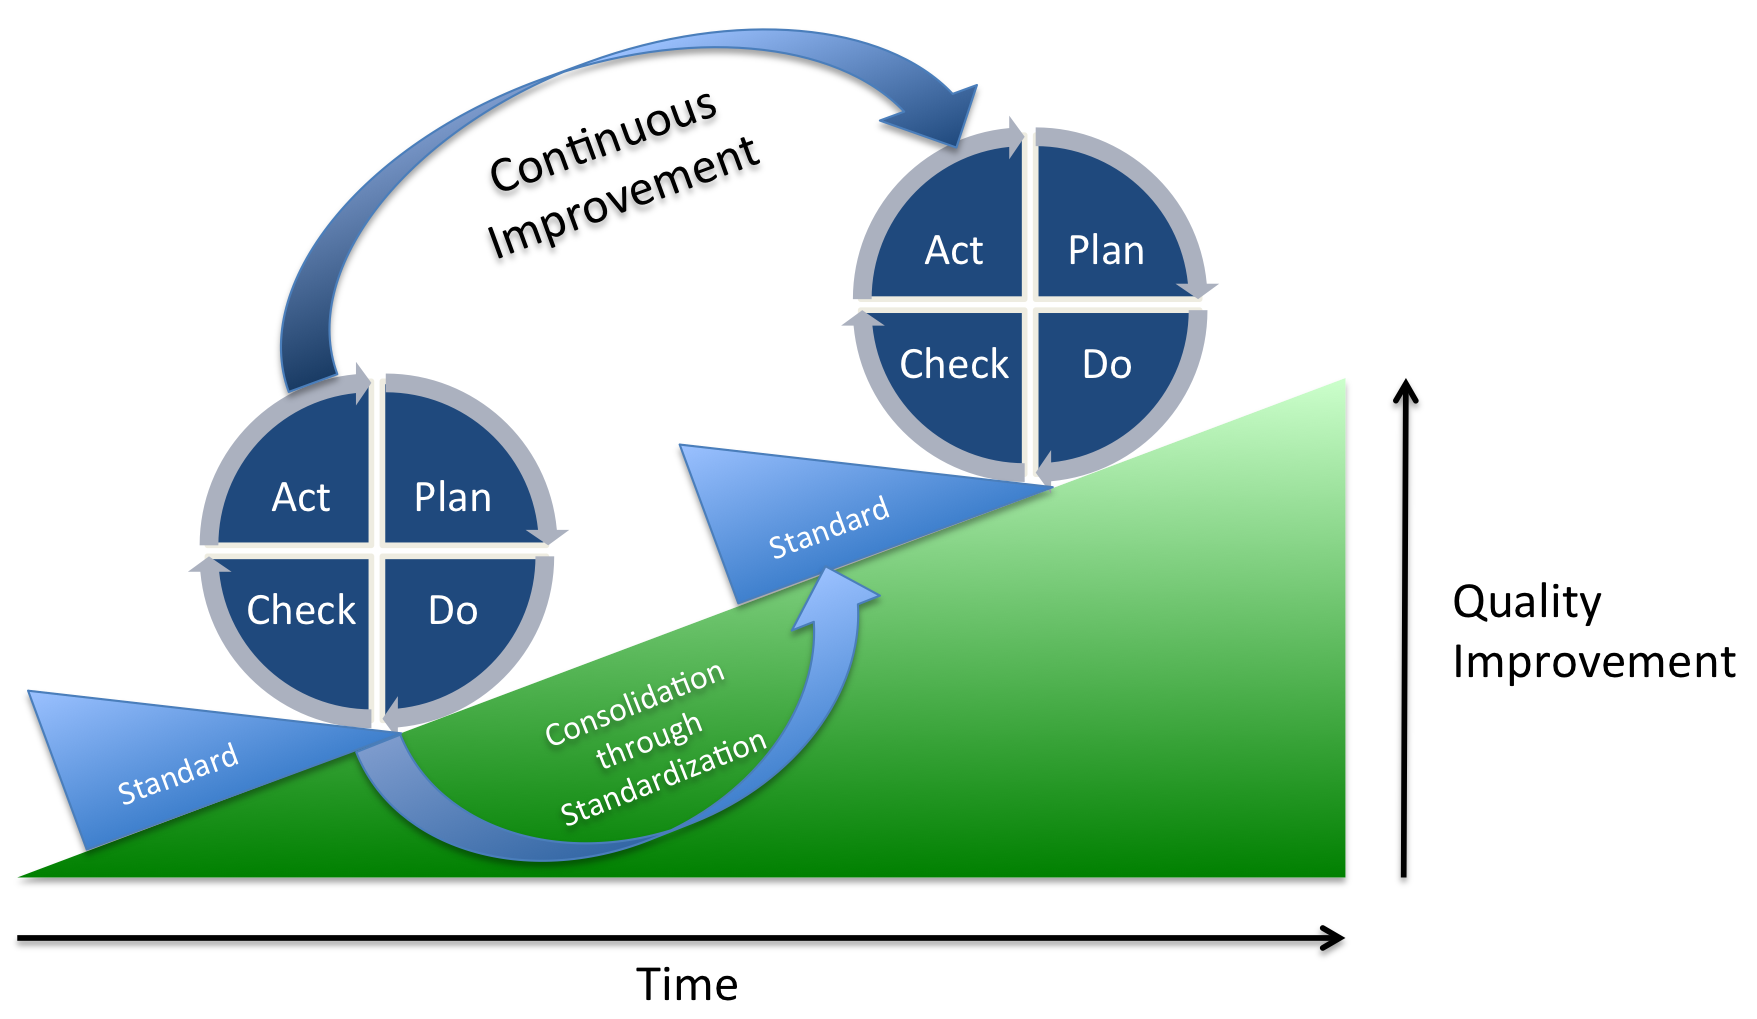
Plan-Do-Check-Act (PDCA) — It is an iterative process to control and continually improve the process or performance of a product.
This model is highly used in lean Manufacturing.
- Plan- Establish Objectives.
- Do- Objectives of the Planning phase is achieved.
- Check- Data results from the previous phase are analysed.
- Act- Implementation of the continually improved process.
Advantages
- The implemented solution is eliminating not only the symptoms but also the higher-level causes.
- The probability of recurrence of a problem is very low.
- Conduction of an RCA process brings into light the flaws in the systems. Attempts to remedying the flaws future-proofs the system.
- The RCA brings the departments on a common platform. This may increase the communication and exchange of valuable data, in turn strengthening the Organization.
- The teamwork associated with the analysis strengthens the interpersonal relations of members.
Limitations
- The primary limitation of Root cause analysis is its time-intensive nature.
- More resources have to be poured in to have the optimum results. The resources allocated to such an analysis must be optimum and minimum. Thus, the output of the analysis depends on the skill of the manager.
- Root- Cause Analysis can cause delays and reduce the revenue generated.
Improvians Take
The application of the discussed methodologies are as follows:
Ask Why Five times- This model is implemented when the nature of the problem is less complex. This methodology is should be the first response to the detection of a symptom of a problem. These apply in all types of processes from the Design of a product to large scale production.
Events and causal factor analysis— This process is widely used for major, single event problems. This cannot be used in case of continually recurring problems in a manufacturing setup.
Change analysis and Barrier analysis— These methods are used to find the probable causes in any Study of Root cause analysis.
Kepner-Tregoe Problem Solving— This model is quite extensive. These were used by NASA in many spaceflight operations. Used in solving the complex problems methodically. They are generally not used in the case of defectives in large production.
Six Sigma DMAIC (Define- Measure- Analyse -Improve -Control) —This method is used for improving the quality standards of a manufacturing process.
Plan-Do-Check-Act (PDCA)— Being an iterative process, it focuses on continual improvement. It assumes that skills and Knowledge are limited. Thus, it is used in cases where the team consists of numerous people. In such a condition, the knowledge and skill increase gradually. Root-Cause analysis using this method is more gradually than fast.
Eight Discipline (8D) model- It provides concrete disciplines to produce a permanent corrective action based on statistical data analysis. These are more evidently employed in the automotive industry.
At Improvians, we can help you with all your problem-solving requirements.
- https://en.wikipedia.org/wiki/Pareto_principle
- https://asq.org/quality-resources/eight-disciplines-8d
- https://en.wikipedia.org/wiki/Flowchart
- https://en.wikipedia.org/wiki/PDCA
- A. Mark Doggett (2005) Root Cause Analysis: A Framework for Tool Selection, Quality Management Journal, 12:4, 3445 , DOI: 10.1080/10686967.2005.11919269
- Anderson, Bjorn: Root Cause Analysis: Simplified Tools and techniques, ASQ Quality Press,2006
- Okes, Duke: Root cause Analysis, ASQ Quality Press,2019
Our Blogs